Survey Statistics report is accessible to supervisors and headquarter users, observers, and administrators.
The report presents basic statistics calculated on survey data currently on the server and eliminates (in some cases) the need to export the data for calculation of these statistics.
The report is always built within a single survey and is built for one of the questions in that survey.
The report may be presented in one of the two modes: tabulation or summary statistics. Summary statistics mode is always applied for the numeric questions, tabulation mode is always applied for categorical (single-select or multi-select questions).
For questions of numeric type
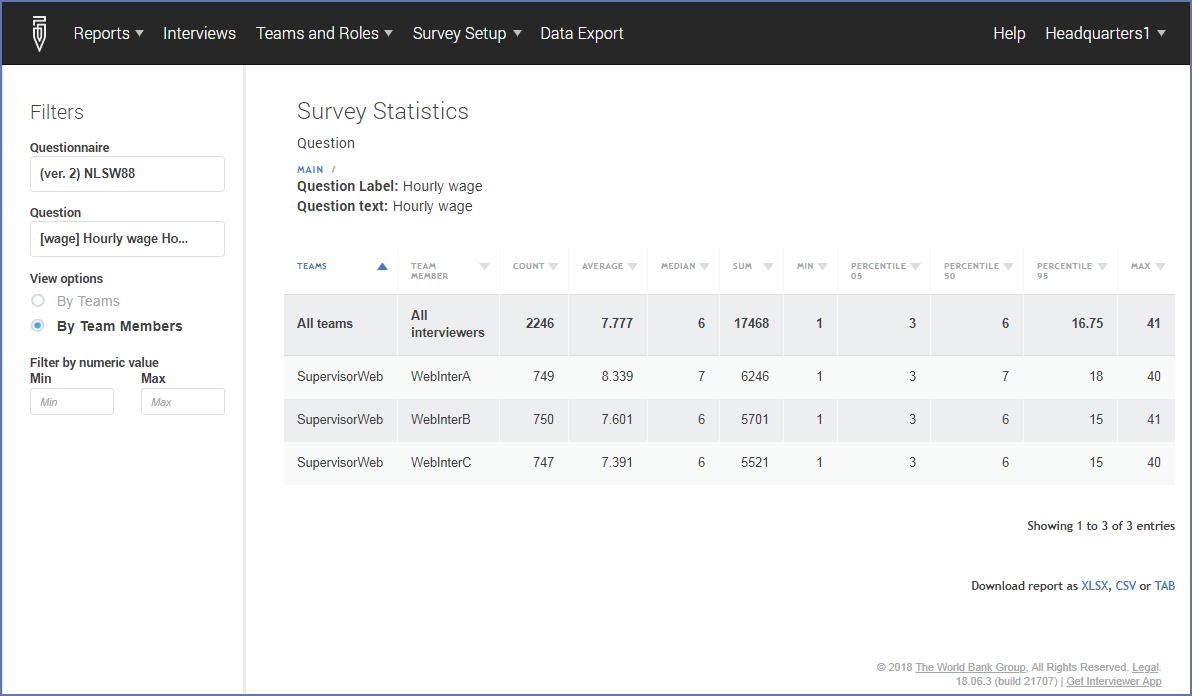
The report presents the following descriptive statistics in the columns: count, average, sum, minimum, maximum, and percentiles: 5th, 50th and 95th. The rows of the report correspond to teams or individual interviewers (selectable). The values may be restricted by specifying the minimum and maximum. Specifying a minimum of zero is commonly used to exclude the special values in numeric questions, often denoted with -999, -997, or similar values.
For questions of categorical type
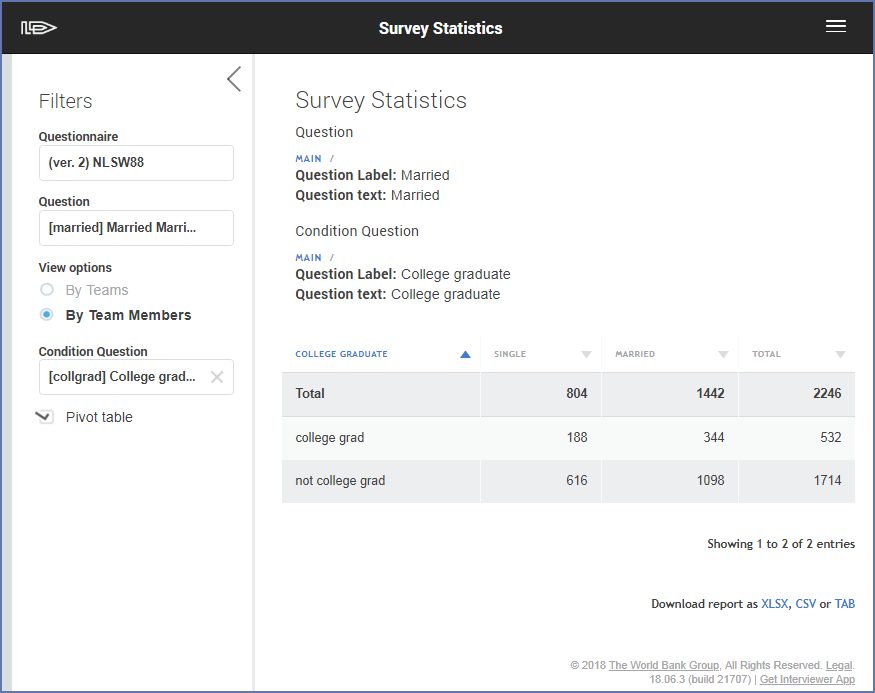
The report presents a frequency tabulation of the selected question by its categories in the columns and teams or individual interviewers (selectable) in the rows. A second categorical question may be specified as a condition question. Then the report may be filtered by categories of this question. For example, the tabulation of occupation may be reported separately for male and for female workers. If a two-way tabulation is of interest, it can be produced by checking the “pivot table”ť checkbox. In this case the second question selected for conditioning will be used as a second dimension of the two-way tabulation. The selection of teams or interviewers is ignored in this case. Totals by rows and columns are included.
The report can be downloaded in XLSX, CSV, or TAB delimited format.
NB: While technically the following questions are of categorical type, they are not going to be available for selection in the survey statistics report (since this can potentially result in huge tables):
- linked categorical questions;
- filtered combobox questions;
- cascading categorical questions.